Outpatient Therapy Productivity Benchmarks
Outpatient therapists get compared to their SNF colleagues constantly, and someone always asks why the outpatient number looks lower. Here’s the real answer: outpatient clinics run on a completely different rhythm. More friction, more unpredictability, and none of it shows up in a bare percentage range.
Typical Outpatient Productivity Benchmarks
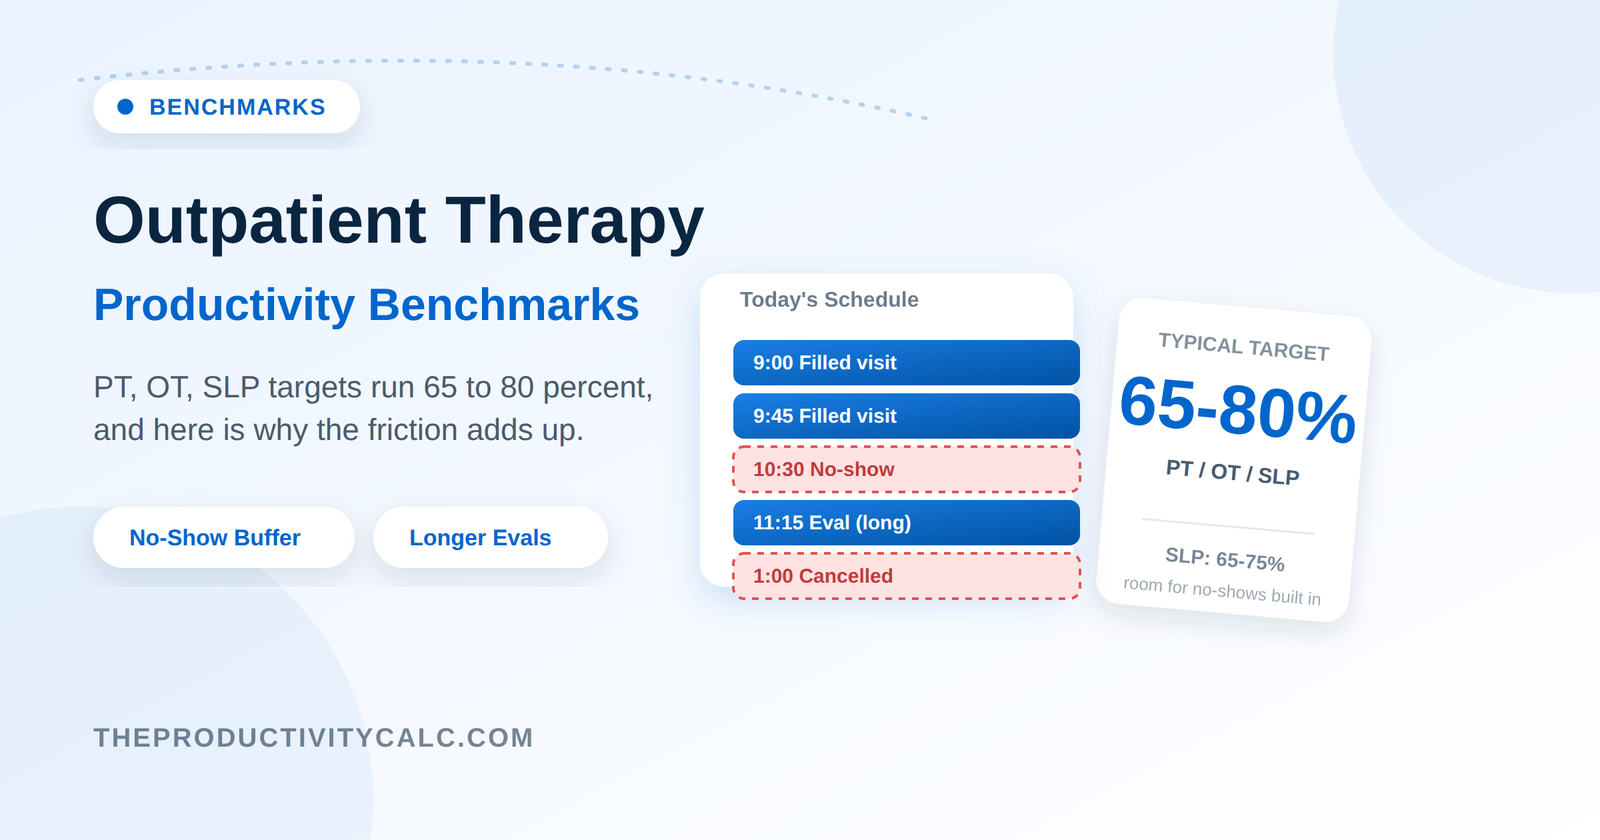
- PT / OT: 70%–80%
- SLP: 65%–75%
Outpatient productivity sits well below SNF and home health for a few concrete reasons. No-shows and late cancellations happen daily. Initial evaluations take longer than follow-up visits, yet clinics often schedule both in the same slot length. Non-billable admin piles up too — prior authorizations, insurance calls, progress notes tied to specific payer formats. A benchmark table skips all of this. But it’s exactly what decides whether 75% feels manageable or nearly impossible.
What a 75% Target Actually Looks Like
Take an 8-hour day — 480 minutes. A 75% target means 360 billable minutes. That leaves 120 minutes for notes, no-shows, and everything else. Compare that gap to SNF’s tighter margin, and you see the point: outpatient scheduling has to absorb far more unpredictability.
- Here’s where it gets messy in real life. Two patients cancel same-day, and you can’t backfill the slots. Your target doesn’t move, but your available billable minutes just shrank. Run that scenario through the Standard Calculator and see, in real time, what your new “perfect end time” needs to be — no guessing required.
- Utilization matters here too, and it’s a different number entirely. It measures how much of your scheduled time actually got filled with booked patients, before billable minutes even enter the picture. Low utilization from chronic no-shows points to a scheduling problem, not a productivity problem. The Therapy Utilization Calculator isolates that number specifically.
Why the Target Runs Lower — and What Pushes It Down Further
A 60-minute eval slot that nets only 45 billable minutes — because of paperwork and history-taking — drags your daily average down even on a fully-booked day. Heavy eval caseloads push your realistic productivity toward the bottom of the 70–80% range. The Caseload Calculator shows you how that patient mix actually shapes your week.
Documentation format adds another layer. Payer-specific note requirements — Medicare Part B, workers’ comp — often add real minutes per visit that a generic benchmark never accounts for. If your clinic’s target feels chronically out of reach, compare your actual documentation time against the assumption baked into that target using the Documentation Time Calculator.