Home Health Productivity Benchmarks
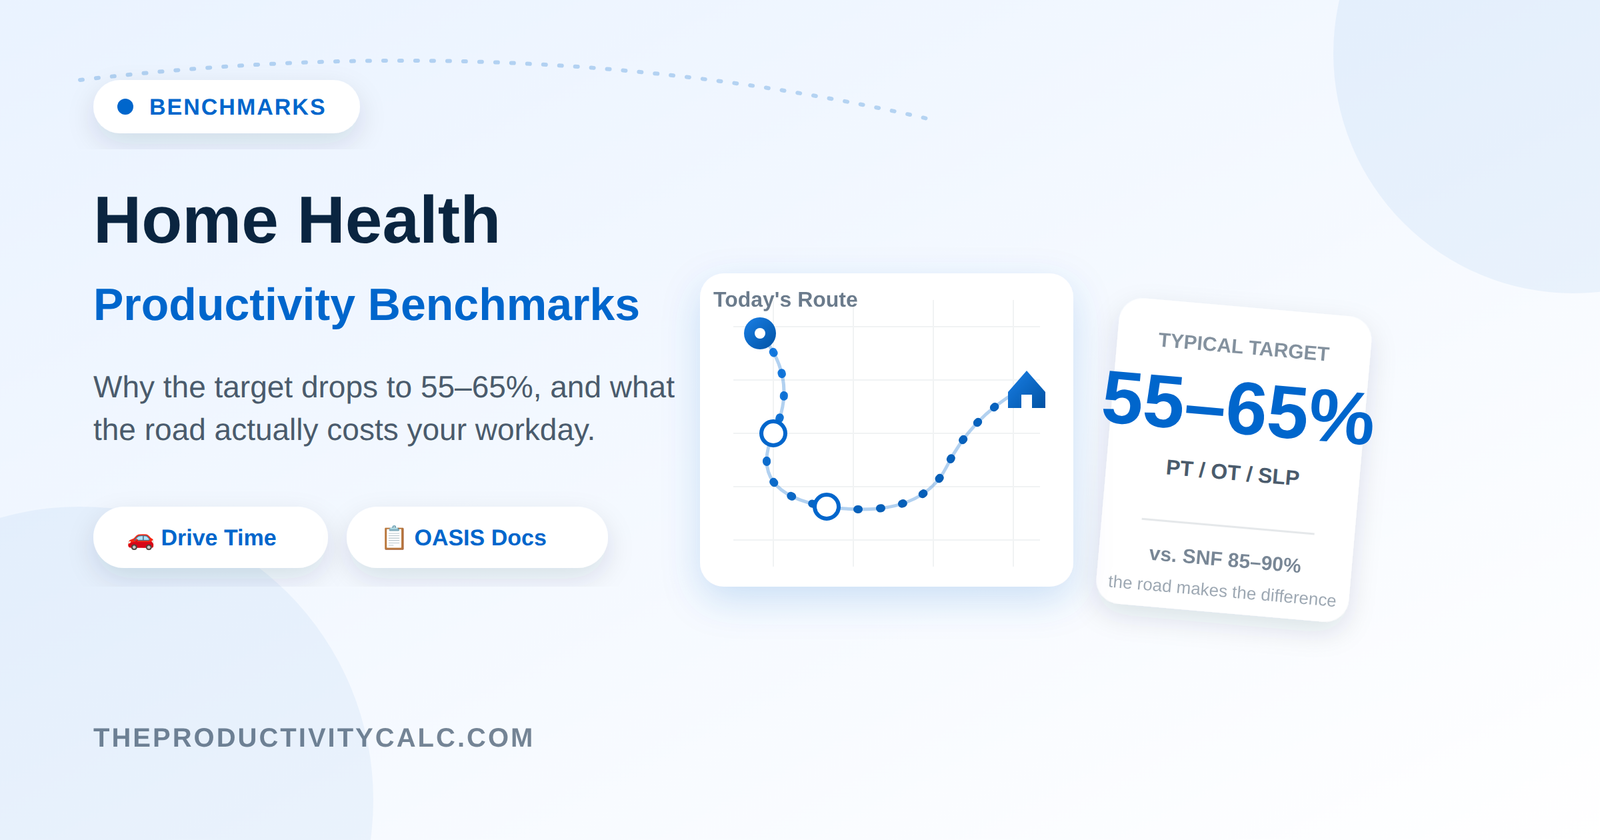
Home health is the one setting where productivity benchmarks consistently confuse people moving over from SNF or outpatient — because the number drops, sometimes by 30 points, and it’s not because home health therapists work less. It’s because the clock includes something the other settings don’t: the road.
Typical home health productivity benchmarks
- PT / OT: 55%–65%
- SLP: 55%–65%
Compare that to SNF’s 85–90%, and it looks like a huge gap in effort. It isn’t. Home health productivity has to absorb drive time between visits, parking, waiting for a patient to answer the door, and documentation that’s often done point-of-care using longer OASIS-based formats for Medicare-certified visits. None of that is billable, but all of it is real time on your workday.
What 60% actually looks like
On an 8-hour day (480 minutes), a 60% target comes out to 288 billable minutes — meaning 192 minutes, well over three hours, is expected to go to travel and documentation combined. That’s the built-in reality of a caseload spread across a service area rather than a single building.
A rural caseload with 20-minute drives between visits eats far more of the clock than a dense suburban route. If your target doesn’t account for that, run your actual schedule through the Standard Calculator to see what end time your real travel pattern produces, rather than assuming the benchmark applies evenly to every route.
Why the target sits so much lower — and where it gets missed
OASIS documentation (especially SOC, recertification, and discharge) and missed visits are two of the biggest hidden productivity drains in home health. Tracking documentation and travel time separately helps identify the real bottleneck. The Documentation Time Calculator shows how much of your workweek is spent on notes, while the Caseload Calculator helps determine whether travel—not clinical pace—is limiting productivity.